
A financial modeling workspace for ModelDrive

ModelDrive is a modern financial modeling workspace built to replace the chaos of Excel. Designed for professionals dealing with complex models, it helps teams build structured, error-resistant workflows, manage data cleanly, and collaborate without the mess of version control.
We designed the platform from the ground up to make financial modeling faster, smarter, and easier to scale.

It still looks like a spreadsheet, so analysts feel at home – but every number carries a dimension, a color-coded variable and a unit.
Result
ModelDrive turned financial modeling from a fragile spreadsheet juggle into a structured, scalable system. It reduced errors, boosted team productivity, and enabled deeper focus on strategic insights. With clear workflows and a collaborative hub, financial professionals could finally stop managing the tool – and start mastering the model.

Custom 3D icons give abstract modeling ideas like formulas and dependencies a shape, in the product and on its website.

The logo is built from blocks, like the models themselves: structured parts that fit together.
Process
We kicked off with deep user research, speaking directly with financial analysts and decision-makers who lived in spreadsheets daily. Their pain points were clear – fragmented data, error-prone workflows, and collaboration bottlenecks. Excel wasn’t just a tool anymore; it was a liability.
We mapped out key modeling workflows, benchmarked common UI pitfalls in existing platforms, and defined a structure that could bring clarity without oversimplifying. Our solution was a folder-based system for model management, paired with structured variable handling and streamlined data entry.

A team sees who changed what, and talks it through in place, instead of passing copies of the file around.
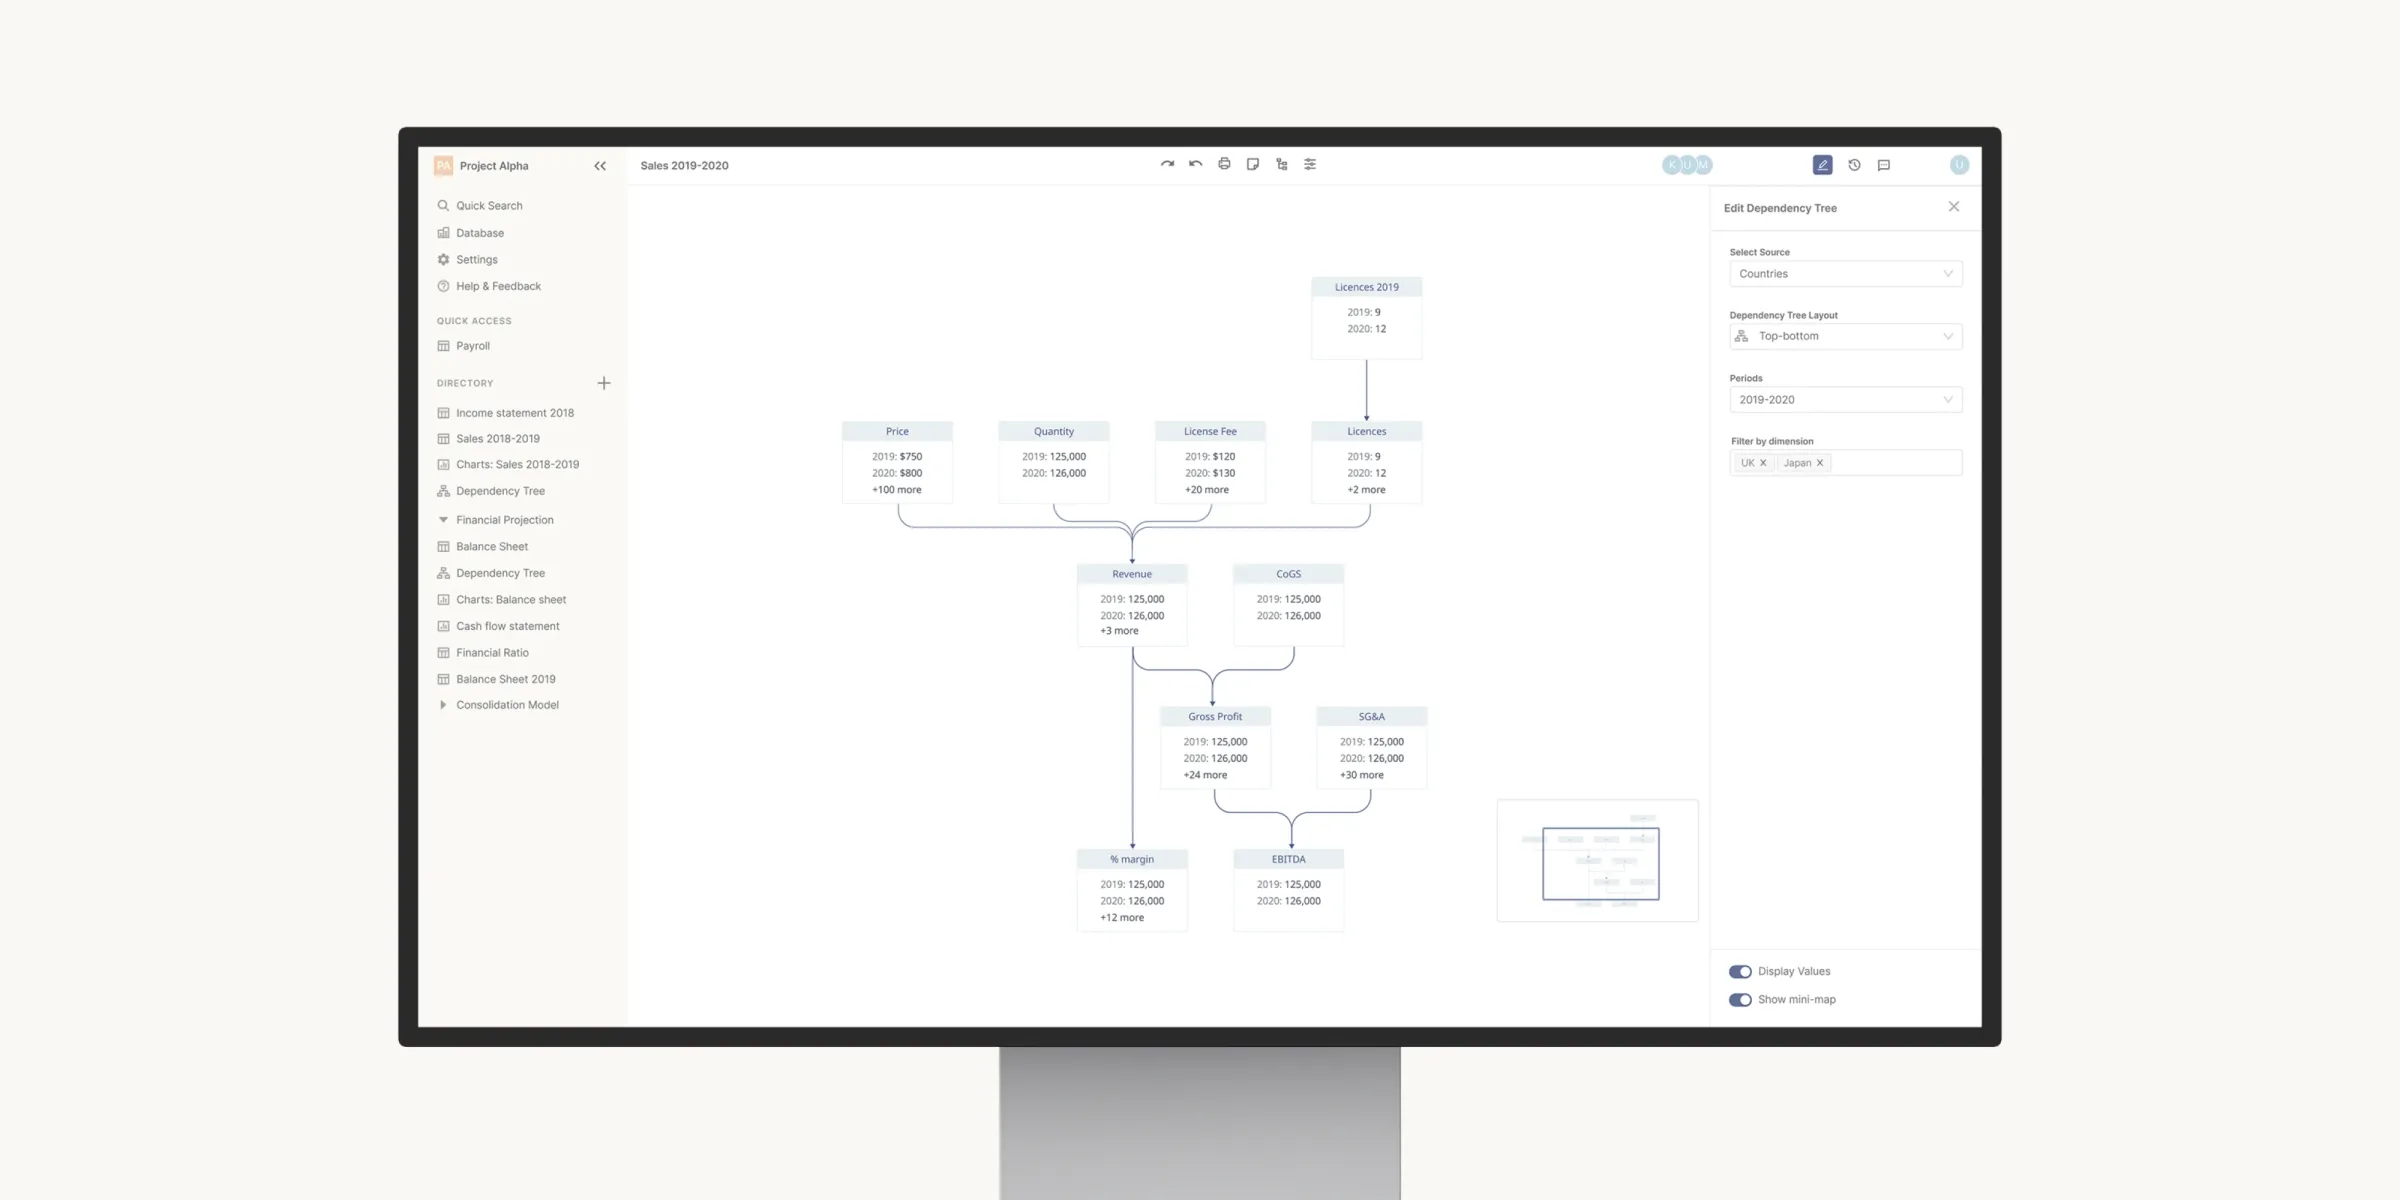
When a total looks wrong, the dependency tree shows every number that feeds it, so the error can be traced to its source.
Designing the interface meant striking a balance – powerful enough for professionals, intuitive enough to reduce errors. We prototyped early, tested often, and iterated quickly based on user feedback. Variable creation, version control, and shared access were all refined through real-world use cases.
Instead of cramming everything into a flat spreadsheet-like experience, we introduced modularity. Models became structured, reusable components. Teams could collaborate in one shared space, confident their changes wouldn’t disappear in a sea of tabs.

Powerful but hard to get wrong: each job, from tracing a formula to adding a dimension, gets one small dialog of its own.

Charts are built and styled inside the model, next to the numbers they show, without exporting to another tool.